
In an earlier blog, we examined the board-by-board impact of Minister Lecce’s bargaining table offer to raise high school class sizes from 22 to 25. While this marks a smaller jump than the currently approved policy, it is still an increase, regardless of the Minister’s insistence that this is an offer to “lower” class sizes.
Under the government’s new approved policy, announced in March, class sizes in Grades 4 to 8 would increase from 23.84 students per teacher to 24.50; class sizes in high school (Grades 9 to 12) would go from 22 students to 28. The plan also includes requiring high school students to earn four (out of 30) credits online instead of in the classroom.
According to Ontario’s Financial Accountability Office (FAO), these changes will result in 10,054 fewer teachers in Ontario’s classrooms by 2023-24. The vast majority of these losses will be in high schools due to the scale of the increase in class size and the four mandatory online credits.
The FAO model takes into account projected enrollment growth; as the school-age population grows, so does the need for teachers. The model then compares the number of teachers that will be employed under the new plan with the number of classroom teachers that would have been in the education system if the government had not increased class sizes and made online learning mandatory.
The province created a temporary Job Protection Fund to ease the transition. Some teachers have already lost their jobs, and many students have already lost their teachers, but the full impact of these changes will be felt in the 2023-2024 school year.
We built a comparable model to the FAO, using publicly available data, and arrived at a similar estimate for teaching jobs lost province-wide (9,984). Then we calculated job losses board by board.
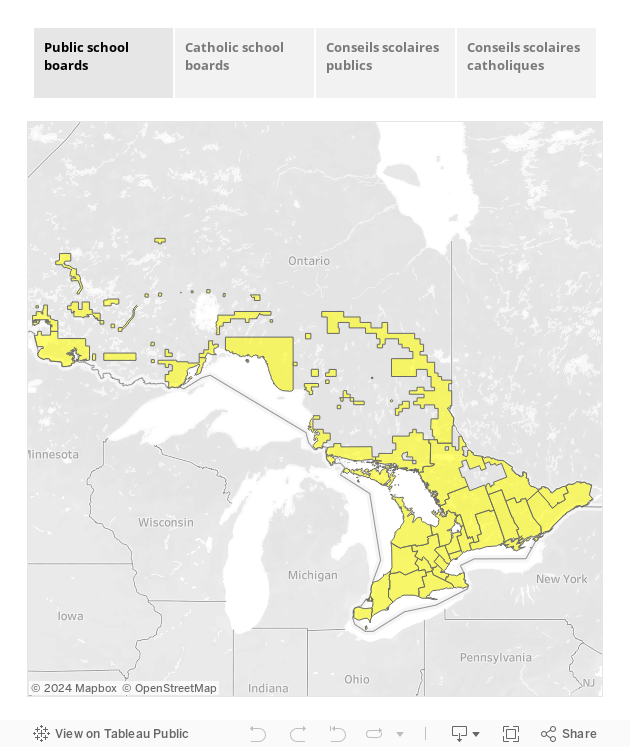
The interactive map below shows the impact of these changes on educators in each community, mapped by school system (English public school boards, English Catholic school boards, Conseils scolaires publics, Conseils scolaires catholiques) and broken down by elementary schools and secondary schools. Click to explore the board-by-board staffing numbers, press the home button to refresh the view.
The more students there are in each board, the more teaching positions eliminated. Our model assumes a uniform 0.8% enrolment growth across school boards and the full implementation of the e-learning policy in 2020-2021.
The model only captures classroom teacher positions funded through the Pupil Foundation Allocation; it does not include other classroom staff and education workers who are funded through other grants. Additional analyses are needed to capture these losses.
Ricardo Tranjan is a senior researcher with the Canadian Centre for Policy Alternatives’ Ontario office. Follow Ricardo on Twitter: @ricardo_tranjan.